Sparking a national debate with timely and actionable analysis
Early in my career, as Head of Insight at the London Borough of Barnet, I delivered a piece of strategic foresight that would come to spark a national debate on local government funding.
In 2010, local authorities across the UK were under immense financial pressure, and Barnet was no exception. As part of a broader State of the Borough strategic analysis, I produced the original and now iconic Barnet Graph of Doom. This simple chart starkly illustrated the growing disparity between available funding and the rising costs of providing essential services. It was a powerful tool, designed to cut through complexity and deliver a clear message.
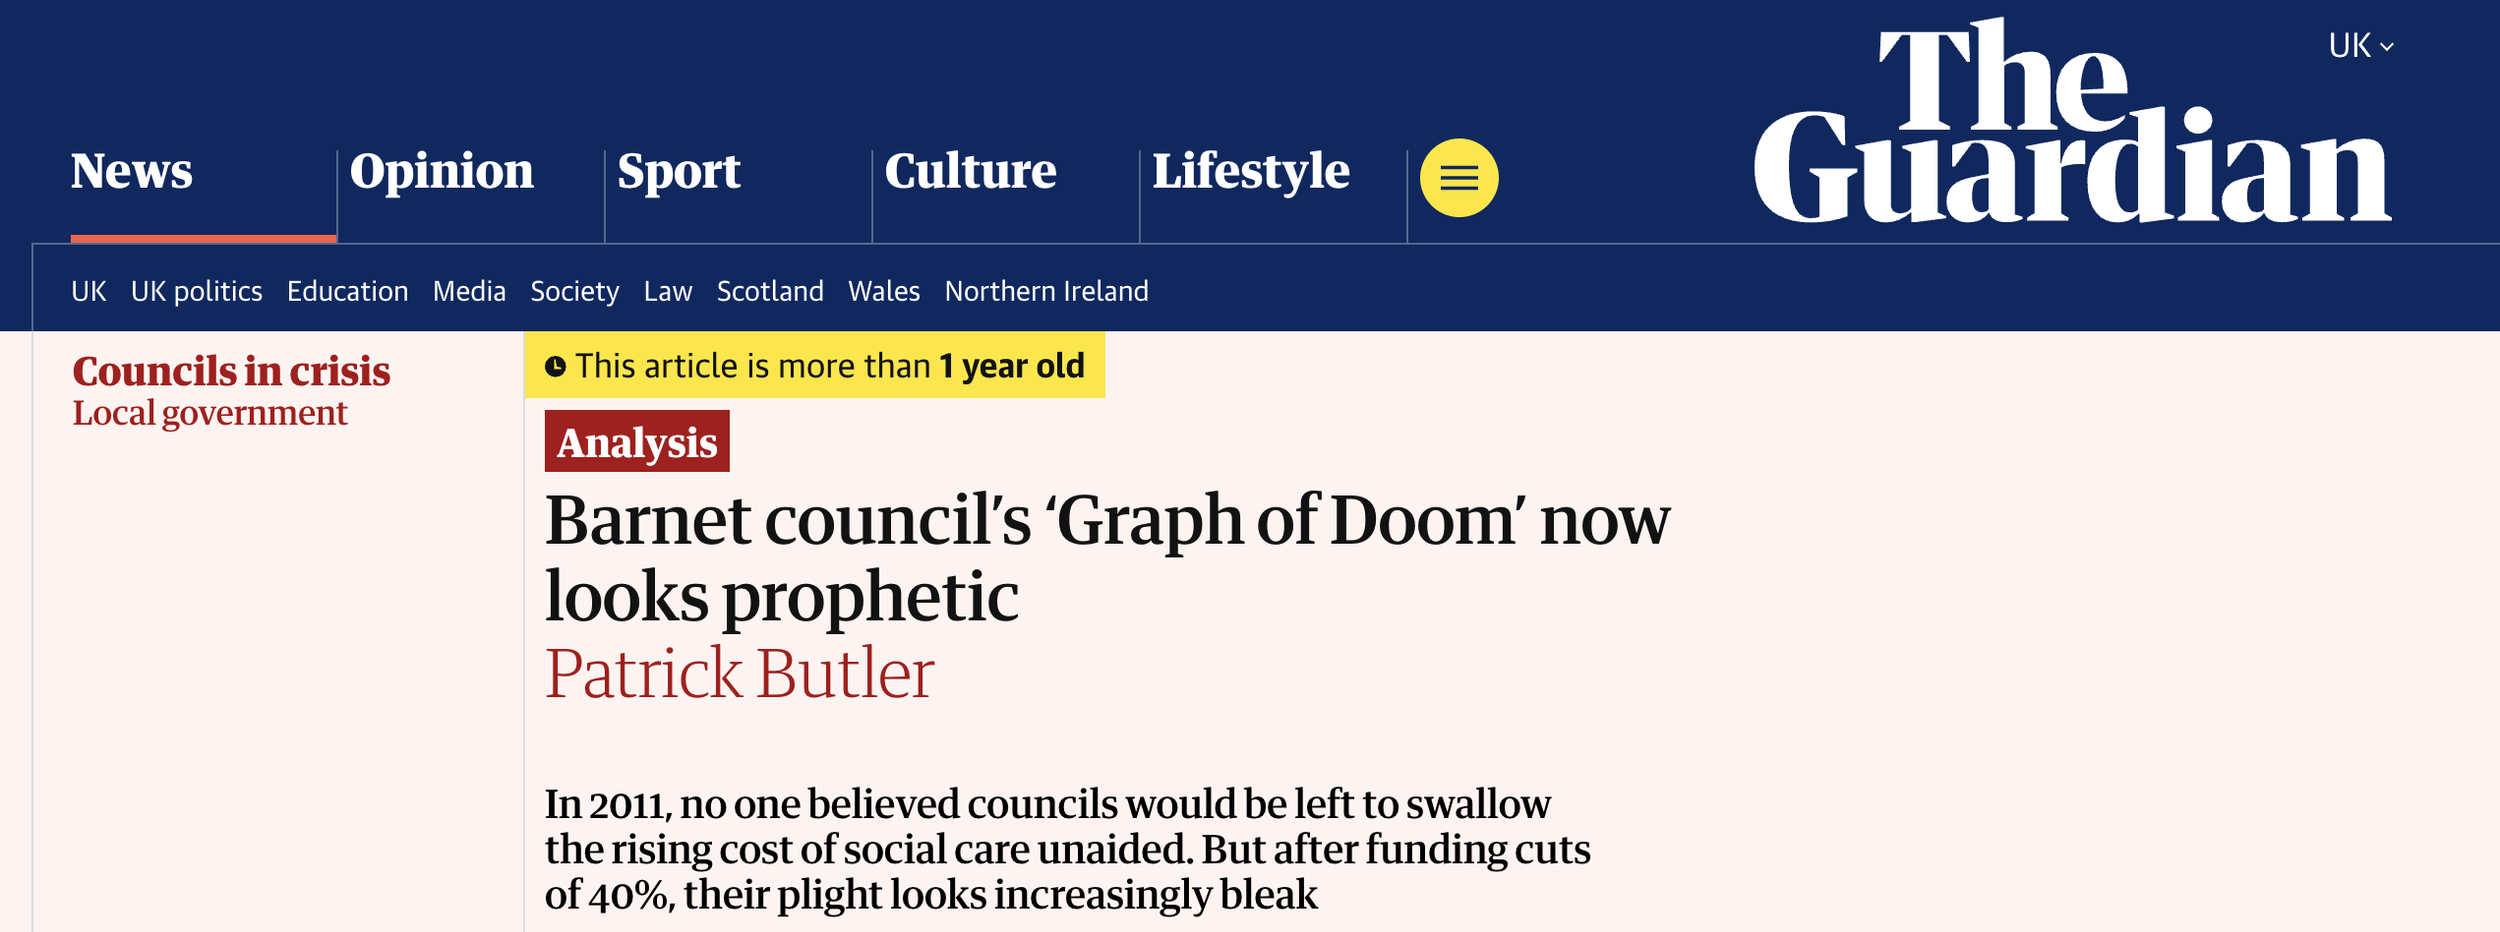
The "Barnet Graph of Doom" proved to be more than just a forecast; it was a chillingly accurate prophecy. It shaped Barnet Council's response to the financial challenges and ignited a national debate about the sustainability of local government funding. Its accuracy has been validated by subsequent events, with councils across the country now grappling with the very pressures my analysis predicted. As recently as January 2024, The Guardian acknowledged the graph’s prophetic nature and its role in predicting the funding crisis now faced by local councils.
